-1.jpeg?width=2000&name=AdobeStock_86786638%20(1)-1.jpeg)


Working on a tight budget?
We meet Trusts where they are. We’ll work with you to implement SPARK® on a scale that meets the needs of your Trust.
Powerful as a product, even stronger as a team
Our vision to engage and entertain patients and visitors in hospitals, to boost well-being and faster recovery, is achievable with your help.
We work with the NHS and app providers to increase the efficiency of staff and healthcare professionals.
Our mission is to minimise cost and wastage, shorten wait times and reduce bed blocking using managed wireless network solutions.
Together, we can provide every patient with free entertainment in hospitals across the UK.
SPARK CONNECT®
SPARK Connect® does what it says on the tin — connects people through WiFi and provides wards with a platform to engage with patients and drive digital transformation.
This foundational WiFi connection enables you to provide the SPARK Fusion® Web solution throughout the hospital.
SPARK Fusion® Web is provided to every SPARK Connect® customer as standard.

- Engage with patients in a way that suits them
- Harbour safe, secure and 24/7/365 management and support
- Provide free WiFi connections for patients and staff


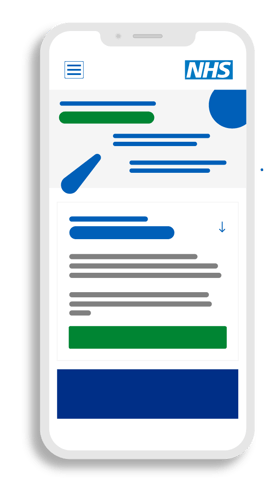
SPARK FUSION® WEB
Educate, inform, engage and entertain patients and staff, on their own or hospital-provided devices.
Every SPARK Connect® customer receives SPARK Fusion® Web, a web-based platform that seamlessly links to curated websites.
SPARK Fusion Web customers can upgrade to the full package, providing access to Freeview TV, digital magazines, and more.
Our solution means entertainment and engagement services are free for patients from their chosen device.
- Relieve patient boredom and improve well-being
- Give patients the option to use the device they’re most comfortable with
- Provide free entertainment and information to patients


SPARK FUSION®
SPARK Fusion® is a future-ready healthcare tech solution designed to tackle the biggest operational challenges in the NHS and other healthcare systems.
The powerful Apple iPad software allows patients to access entertainment and engagement applications from their bedside and make them feel more involved in their care.
Trusts with outdated Hospedia units can make the most of this existing infrastructure to save money on installation and minimise disruption.

- Bridge the digital gap between generations
- Improve staff efficiencies by using SPARK Fusion® with HL7 integration
- Provide specialist care and information to patients

The future of care starts now
As a buildable platform, SPARK Fusion® is the conduit to present thousands of applications within healthcare environments.
It’s an advanced app platform that helps Trusts create and integrate health, care, entertainment and engagement apps into their services. Meet the needs of your patients and visitors more effectively and efficiently with modern technology.


Standard apps include radio, games, newspapers, magazines and surveys. Hospitals can upgrade and add additional apps and services they’d like to feature, including TV, Netflix, Amazon, YouTube, BBC iPlayer, and shopping and parking apps.
Specialist clinical apps can also be selected, such as electronic meal ordering, electronic observations and electronic patient records. They’re chosen based on your specific needs and can be customised by ward.


Join a community working towards the digital transformation of healthcare
See all events